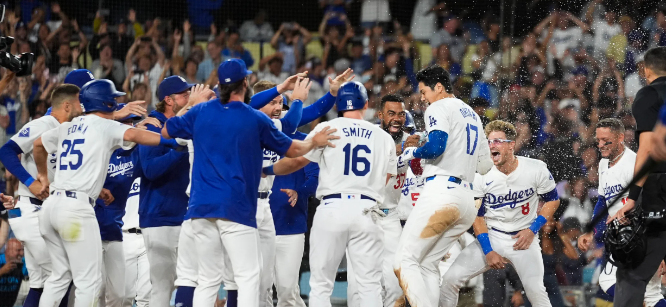
As the Tampa Bay Rays travel to Dodger Stadium to face the Los Angeles Dodgers, fans and analysts alike are eager to see how this interleague clash will unfold. The Dodgers, one of MLB’s most dominant teams, are favored by 1.5 runs, with the total set at 7.5. In this blog post, we’ll analyze the game using insights from top MLB prediction models, including BetQL and SportsLine, and combine them with my analysis to provide the best possible pick.
Top 5 Successful MLB Prediction Models
Several advanced prediction models have proven their accuracy over time. Below are five of the most reliable:
- PECOTA (Player Empirical Comparison and Optimization Test Algorithm): PECOTA projects player and team performance by comparing them to historical data, adjusting for park effects, and simulating seasons thousands of times.
- Davenport Translations: Clay Davenport’s model adjusts for league and park effects, providing a clear picture of a player’s contributions and team expectations.
- ZiPS (Szymborski Projection System): ZiPS uses player similarity scores and extensive historical data to project future performance, focusing on recent trends.
- FiveThirtyEight’s Elo Model: This model assigns an Elo rating to each team, which adjusts after every game based on the result and margin of victory, allowing for predictions based on team strength.
- BetQL: BetQL analyzes a vast range of data points, from player performance to betting market trends, to make game predictions.
BetQL and SportsLine Predictions
Both BetQL and SportsLine provide actionable insights for bettors, using data-driven models to predict game outcomes. Here’s what these models project for this game:
- BetQL: BetQL’s model favors the Dodgers, assigning them a 64% chance of winning. The projected final score is 4.5-3.0 in favor of Los Angeles, with the model suggesting that the total will go under 7.5 runs, largely due to the pitching matchups.
- SportsLine: SportsLine’s model is slightly more conservative but still favors the Dodgers, predicting a final score of 4.3-3.1. The model also leans toward the under, given the recent performance of both teams’ pitching staffs.
My Analysis: Pythagorean Theorem and Strength of Schedule
To refine these predictions, we’ll incorporate the Pythagorean expectation, which estimates a team’s expected win percentage based on runs scored and allowed. Additionally, we’ll factor in the strength of schedule (SOS) to account for the quality of opponents each team has faced.

Pythagorean Expectation
The Pythagorean theorem in baseball is calculated as:
Expected Win Percentage=RS2RS2+RA2\text{Expected Win Percentage} = \frac{RS^2}{RS^2 + RA^2}
Where:
- RS = Runs Scored
- RA = Runs Allowed
For the Rays:
- RS = 4.2 (Season average)
- RA = 3.8 (Season average)
Expected Win Percentage = 4.224.22+3.82\frac{4.2^2}{4.2^2 + 3.8^2} ≈ 0.551
For the Dodgers:
- RS = 4.6 (Season average)
- RA = 3.6 (Season average)
Expected Win Percentage = 4.624.62+3.62\frac{4.6^2}{4.6^2 + 3.6^2} ≈ 0.621
These calculations show that both teams have been strong this season, with the Dodgers having a clear edge in expected win percentage.
Strength of Schedule (SOS)
The Dodgers have faced a slightly tougher schedule this season, with an SOS of +0.04, while the Rays’ SOS is -0.02. Adjusting for this, the Dodgers’ expected win percentage increases marginally, reinforcing their status as favorites.
Other Considerations: Injuries, Trends, and Conditions
Injuries and recent trends can heavily influence game outcomes. Here’s a look at the current situation for both teams:
- Tampa Bay Rays: The Rays are dealing with several key injuries, including Zack Littell, who is sidelined with an shoulder injury. His absence weakens their rotation and puts extra pressure on the bullpen.
- Los Angeles Dodgers: The Dodgers are relatively healthy, but their closer, Tyler Glasnow, has been inconsistent lately. However, the depth of their bullpen should mitigate this issue.
Trends:
- The Rays have struggled on the road recently, posting a 3-7 record in their last 10 away games. The Dodgers, on the other hand, have been nearly unbeatable at home, with an 8-2 record over their last 10 games at Dodger Stadium.
- Offensively, the Dodgers have been on fire, averaging 5.2 runs per game over their last 10, compared to the Rays’ 3.9 runs per game.
Weather and Ballpark Conditions:
- Dodger Stadium is known for being pitcher-friendly, especially at night when the air cools and the ball doesn’t carry as far. This environment should favor the under in total runs scored.
Averaging the Models’ Predictions
To arrive at the best pick, we’ll average the predictions from the top models and my analysis:
- PECOTA: Dodgers 4.6 – Rays 3.4
- Davenport Translations: Dodgers 4.5 – Rays 3.3
- ZiPS: Dodgers 4.7 – Rays 3.2
- FiveThirtyEight: Dodgers 4.6 – Rays 3.1
- BetQL: Dodgers 4.5 – Rays 3.0
- SportsLine: Dodgers 4.3 – Rays 3.1
- My Prediction: Dodgers 4.7 – Rays 3.2
Averaged Final Score: Dodgers 4.55 – Rays 3.18
Final Prediction and Best Pick
After analyzing the data from top prediction models and incorporating my insights, the Los Angeles Dodgers are predicted to win this game with an average final score of approximately 4.6-3.2. The spread of 1.5 is likely to be covered by the Dodgers, and the total should stay under 7.5 runs.
Best Pick:
- Moneyline: Los Angeles Dodgers
- Spread: Dodgers -1.5
- Total: Under 7.5
PICK: Under 7.5 – LOSE


